Raster is faster, but vector is corrector. Part 1
Part 1 of 3.
The title of this piece is an old and well used adage in geographic information system (GIS) communities. I first heard it from my GIS professor almost 30 years ago. I imagine it is still used in teaching today. It is a 'straw man' statement designed to generate discussion. To shortcut, the statement is true. And false. And both. And neither. The knowledge is not in the statement. It is in understanding the circumstances in which each answer applies, and why it is so.
You may not have ever heard of "Vector" or "Raster", but if you've ever leveled dirt using GPS blade control then you have probably used software that has one of the two terms at its core. Understanding what they are helps to understand differences in earthmoving control systems - and how, why, and when one system might perform better than another. It's a pretty lengthy topic, so I've made it a 3 part series.
- Introduction & data models
- Comparing terrain representations
- Civil vs Agriculture
The impetus for this piece was a recent post in an online land leveling group. You can see it below. Almost everything in this 5 paragraph shill piece is wrong or (at best) misleading. But marketers gonna market, and advertisers gonna advertise. We all live with a certain amount of spin and most grown-ups have their own filters. Roll eyes. 🙄 Move on. 🚶♂️
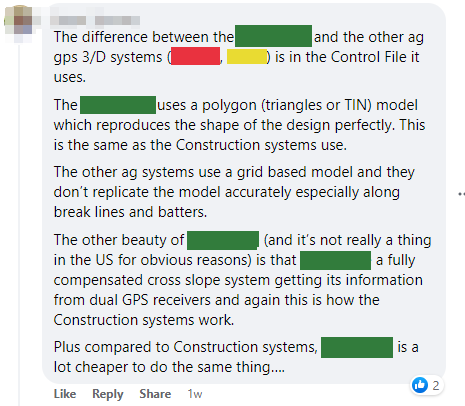
The thing that ground my gears in this instance was the confidently incorrect representation of what should be a completely non-partisan, value-neutral, technical matter. That is, the relative merits of vector vs raster. Unfortunately, most people aren't going to be equipped with the expertise to properly evaluate this.
Background
What do I know? Not much (just ask my kids). But I have created (or overseen the creation of) code to read and write multiple ag and construction file formats, including file formats for all three systems mentioned in the above post. One of the three I personally designed, wrote, and then refined over a 10 year period. I am definitely opinionated about certain things, but not about data algorithms and structures. For these I am dispassionately analytical - because to write good code, you have to be.
Data files for land leveling
Machine control technology is a key part of modern agricultural earthmoving. Its rapid adoption has been driven by:
- Cost reductions.
- Flexibility in design options.
- Improved operator outcomes.
Further discussion on the reasons for, and extent of, machine control adoption is a topic for another post. What is important here is to note that all modern machine control systems rely on digital terrain prescription files in order to achieve desired outcomes.
Operators rarely concern themselves with the exact nature of these files and how they internally represent the terrain. Ideally, they would not need to. The relevant technical details are diverse and often complicated. That said, there are presently instances where knowing the difference between how the files are constructed can have an impact on their operational use. This is unfortunate, and will improve in time. Meanwhile, we will see market noise attempting to capitalize on perceived benefits of one system or another. This article is aimed at owners and operators who hear this noise and want to make more informed judgements.
Types of digital terrain models
The data structures (models) used to represent a field's surface are known variously as Digital Terrain Models (DTMs), Digital Elevations Models (DEMs), or Digital Surface Models (DSMs). These titles mean different things in different geospatial communities, but here we will consider them as being equal.
The models come in multiple flavors. From the standpoint of their internal data representations they can be broadly categorized into one of the below groups.1
- Algorithmic.
- Vector (triangle mesh).
- Raster (grid).
- Hybrid.
Algorithmic
Algorithmic models rely on mathematical equations to define the design surface. The algorithms can be very simple. A construction pad which is flat can be defined by a single variable (eg., height = 300ft). A single- or dual-slope plane can be defined by the equation ax+by+cz+d=0. More complex surfaces can be defined using more complex equations.
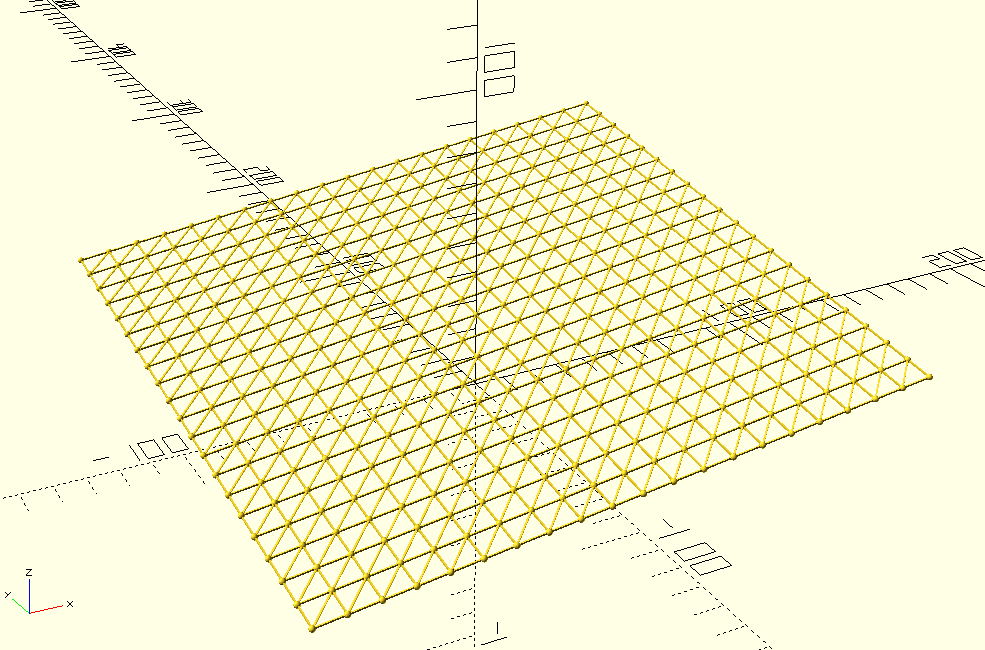
The surface defined by the equation -5x-5y+40z-1000=0
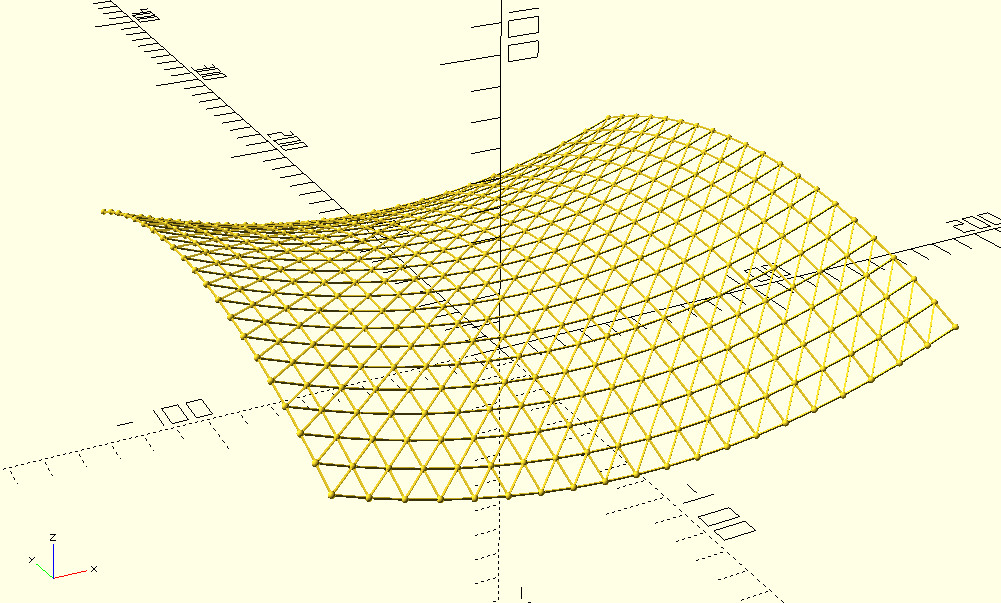
The surface defined by the equation 30+(x*x-y*y)/500-z = 0
Algorithmic models differ from other models in that they do not store individual elevation values for given locations on the surface. Although they store no points, they define an infinite number of points. This is because the algorithm can exactly calculate the elevation at any location.
Vector
A vector based structure is broadly defined as one which is made up of points, lines, or polygons. In the sense we are using the term here we are talking about surfaces composed of adjoining triangles (triangles are simple polygons). The points (vertexes, or nodes) of the triangles need not be distributed regularly. That is, the triangles can be of varying sizes and proportions. These are often referred to as 'triangle meshes', or 'Triangulated Irregular Networks' (TINs).
Vector structures have explicit structure. Each triangle is individually defined by recording the location of each of its vertexes.

A vector mesh layout.
TINs are normally defined as lists of triangle nodes and edges. Nodes (triangle vertexes) can be shared between multiple adjoining triangles. It is efficient to store each node only once and then define a separate list of node triplets which make up individual triangles. The (greatly simplified) layout of a TIN data model is:
Node list
{x1,y1,z1}
{x2,y2,z2}
{x3,y3,z3}
.
.

{xn,yn,zn}

Triangle list
(1,2,6)
(4,1,4)
(1,2,4)
.
.

(n,2,7)
Raster
Raster surfaces consist of a grid of regularly spaced elevations.2 Normally the individual grid cells (also called pixels, or grid points/vertexes) will be square, however they can be rectangular or even diamond shaped.
Raster structures have implicit structure. That is, each cell is positioned relative to every other cell in a well defined manner. A raster format stores a list of elevations plus information about how the cells are laid out. It is not necessary to record the location of each grid point, as this can be calculated based on its position within the elevation list.
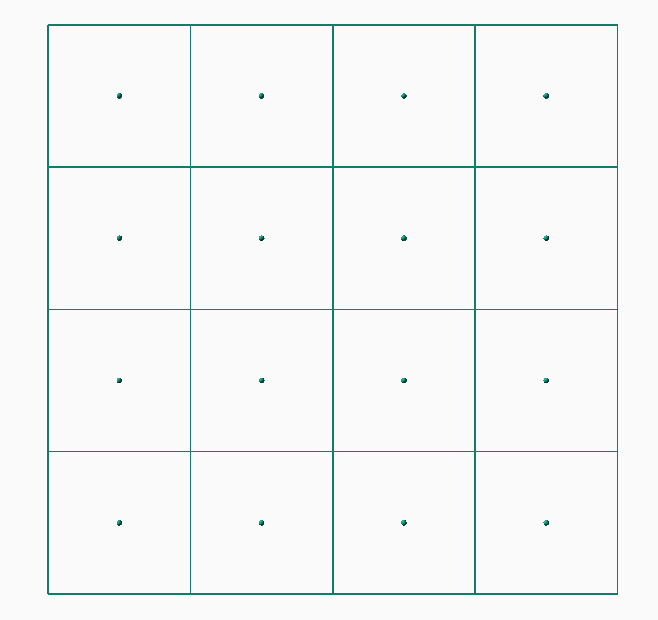
A raster grid layout. The elevation value for a cell may be assigned to the whole grid cell, or it may be associated only with the center point.
The (greatly simplified) layout of a raster data model is:
Location and structure
Origin {x,y,z}
Row count i
Column count j
Cell spacing k
Rotation r

Height list
z1,z2,z3,z4,......zn
Hybrid
A hybrid system is one which uses two or more of the other 3 systems, swapping between them as needed to optimize the result. In addition there are implementations that primarily use one of the above categories, but use them in ways that are more normally associated with another category. For instance, a triangle mesh can be created such that all vertexes are regularly spaced (like a raster). A raster grid can be created with variable grid cell spacing (like a TIN). Finally, there are systems which use different methods for different parts of the process (eg for design vs implementation).
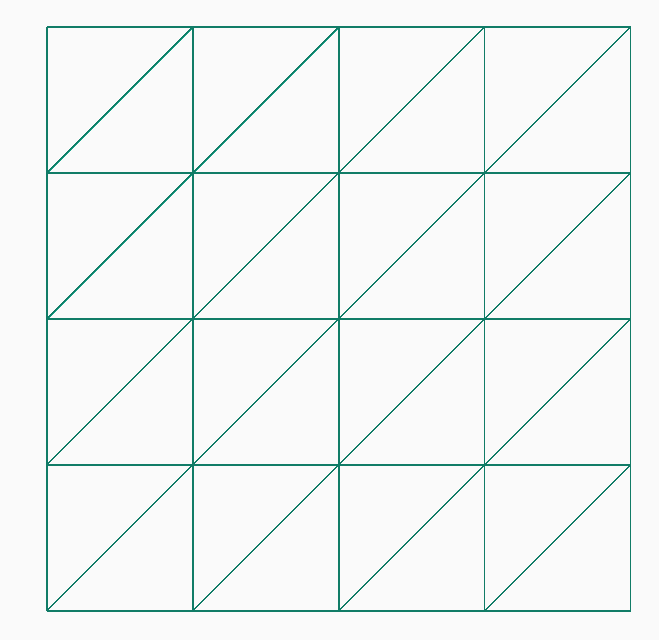
A triangle mesh laid out using a gridded, raster-like structure
Next up: Part 2. Understanding the pros and cons of the different data structures
Post series:
- Introduction & data models
- Comparing terrain representations
- Civil vs Agriculture
There is also a 5th option that is sometimes seen. That is, a polygon based zone representation of heights. This resembles a variable rate fertilizer map with each zone having a target height. It won't be considered here because it is rare and (somewhat ?) amateurish due to the discontinuous (stepped) nature of its output. However, the similarity it shares with other common agricultural data formats may provide certain benefits when deploying to existing machine controllers.↩
Rasters are only uniformly sized with regards to the unit of measurement. For instance, a raster defined using arc seconds as the basic length unit will not have a uniform pixel size in cartesian units.↩